Motivation
For the architecture community, whatever early in the architecture design process or later in the system evaluation, it is time-consuming to run a comprehensive benchmark suite. The complex software stacks of the big data and AI workloads aggravate this issue. To tackle this challenge, we propose the data motif-based simulation benchmarks (IISWC’18 paper) for architecture communities, which speed up runtime 100 times while preserving system and micro-architectural characteristic accuracy.
Also, we propose another methodology to reduce the benchmarking cost, we select a small number of representative benchmarks, called the BigDataBench subset according to workload characteristics from an architecture perspective. We provide the BigDataBench architecture subset (IISWC’14 paper) on the MARSSx86, gem5, and Simics simulator versions, respectively.
1 Data Motif-based Proxy Benchmarks
We embark on a study to bridge the gap between data motif and a practical proxy benchmark. We propose a data motif-based proxy benchmark generating methodology by means of machine learning method, which combine data motifs with different weights to mimic the big data and AI workloads. Furthermore, we implement various data motifs using light-weight stacks and apply the methodology to five real-world workloads to construct a suite of proxy benchmarks, considering the data types, patterns, and distributions. The evaluation results show that our proxy benchmarks shorten the execution time by 100s times on real systems while maintaining the average system and micro-architecture performance data accuracy above 90%, even changing the input data sets or cluster configurations. Moreover, the generated proxy benchmarks reflect consistent performance trends across different architectures.
1.1 Methodology
The data motif-based proxy benchmark generating method- ology is illustrated in Fig. 1. The whole methodology consists of the following steps. For a given workload, we first get its system and architecture level profiles to identify the hotspot functions. Then we correlate hotspots to the code fragments of the workload through bottom-up analysis. After that, we select the corresponding data motif implementations to represent the real-world workload. The final proxy benchmarks are generated using a DAG-like combination of data motifs. To generate qualified proxy benchmark that satisfies the requirements of performance data accuracy, such as cache behaviors or I/O behaviors, we provide an auto-tuning tool to tune the parameters of both data motif and the proxy benchmark.

Figure 1 Data Motif-based Proxy Benchmark Generating Methodology.
Based on the eight data motifs, we provide light-weight implementations using POSIX threads model [29], as illustrated in Fig. 2. Since the workload behaviors are sensitive to input data, we guarantee the sensitiveness of data motifs from the perspectives of data input and implementation. We provide various data input with different types, patterns and distributions, i.e., covering text, graph and matrix data, through data generation tools. Our implementation considers the execution model of software stacks and the programming styles of workloads using specific software stacks, which have great influences on workload behaviors [30], [1]. Fig. 2 lists all data motif implementations for both big data and AI. We use the POSIX threads model and consider the processes of original big data and AI software stacks.

Figure 2 The Overview of the Data Motif Implementations.
Fig. 3 presents the process of proxy benchmark construction, including decomposing process, feature selecting process, and tuning process. We first break down the big data and AI benchmark into a group of data motifs and then tune them to approximate the original benchmark. We measure the proxy benchmark’s accuracy by comparing the performance data of the proxy benchmark with those of the original workloads at both system and micro-architecture level. To tune the accuracy—making it more similar to the original workload, we further provide an auto-tuning tool using a machine learning model, decision tree.

Figure 3 Proxy Benchmarks Construction.
1.2 Five Proxy Benchmarks
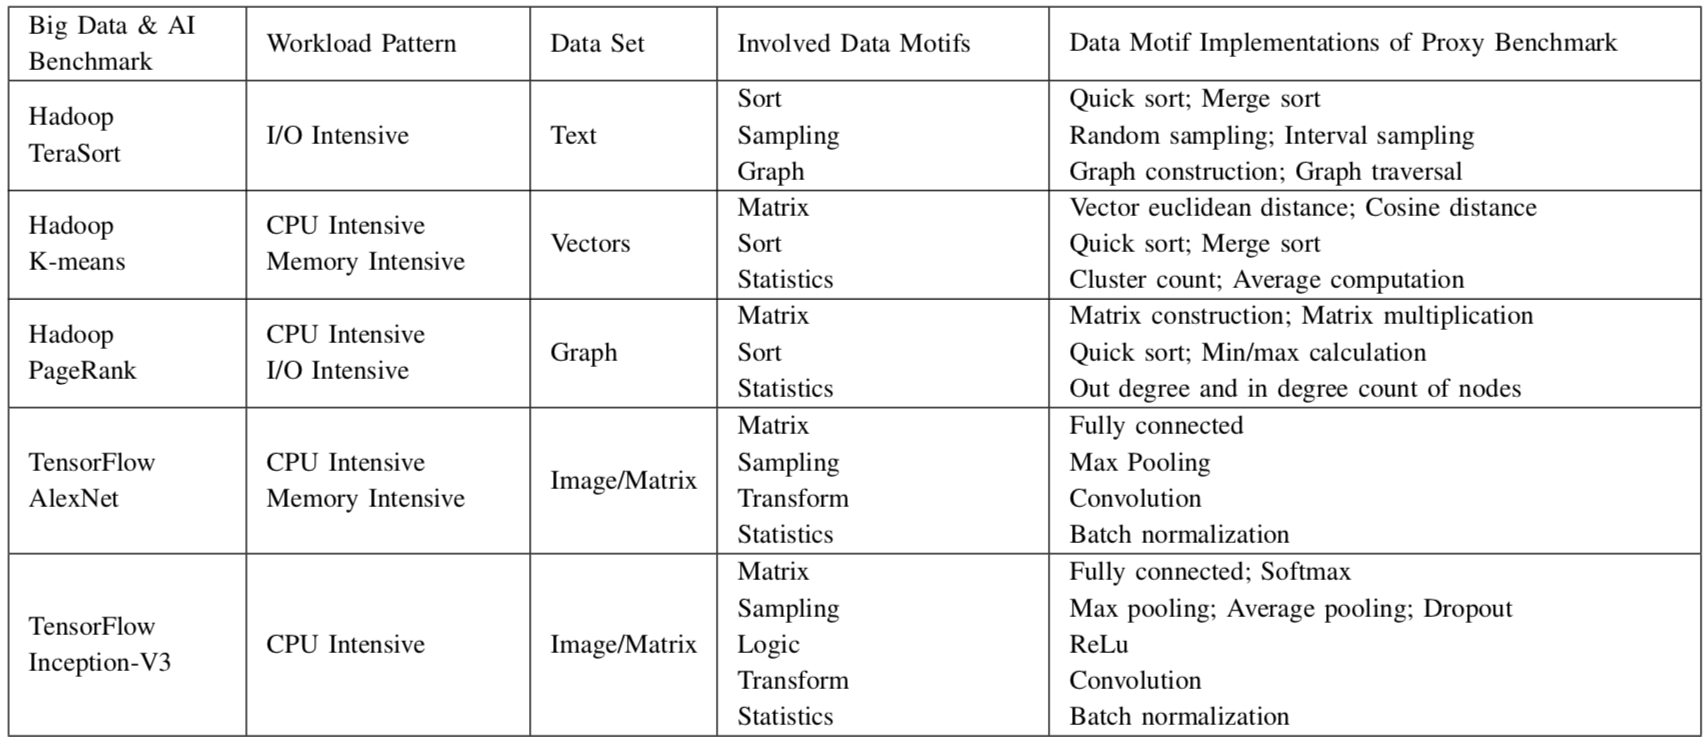
Table 1 Five Proxy Benchmarks.
1.3 Download Proxy Benchmarks
BigDataBench 5.0 proxy benchmark download: /file/BigDataBench5.0-proxy.tar.gz
The package contains five proxy benchmarks---TeraSort, PageRank, Kmeans, Alexnet and InceptionV3. For each benchmark, we provide corresponding input dataset and running script. Users can run the proxy benchmarks directly through the running script.
2 BigDataBench Subset
For system and architecture researches, i. e., architecture, OS, networking and storage, the number of benchmarks will be multiplied by different implementations, and hence become massive. For example, BigDataBench 3.0 provides about 77 workloads (with different implementations). Given the fact that it is expensive to run all the benchmarks, especially for architectural researches that usually evaluate new design using simulators, downsizing the full range of the BigDataBench benchmark suite to a subset of necessary (non-substitutable) workloads is essential to guarantee cost-effective benchmarking and simulations.
2.1 Methodology
1) Identify a comprehensive set of workload characteristics from a specific perspective, which affect the performance of workloads.
2) Eliminate the correlation data in those metrics and map the high dimension metrics to a low dimension.
3) Use the clustering method to classify the original workloads into several categories and choose representative workloads from each category.
The methodology details of subsetting (downsizing) workloads are summarized in our IISWC 2014 paper [PDF].
2.2 Architecture subset
The BigDataBench architecture subset is for the architecture communities. Currently, it downsizes the full BigDataBench 3.0— 77 workloads—to 17 representative workloads. Each workload represents a workload cluster with a different size. Note that BigDataBench architecture subset is all from a computer architecture point of view. Results may differ if subsetting is performed from a different point of view.
1) Microarchitectural Metric Selection
We choose a broad set of metrics of different types that cover all major characteristics. We particularly focus on factors that may affect data movement or calculation. For example, a cache miss may delay data movement, and a branch misprediction flushes the pipeline. We choose the 45 metrics from micro-architecture aspects as follows.
- Instruction Mix
- Cache Behavior
- Translation Look-aside Buffer (TLB) Behavior
- Branch Execution
- Pipeline Behavior
- Offcore Requests and Snoop Responses
- Parallelism
- Operation Intensity
2) Removing Correlated Data
Given a large number of workloads and metrics, it is difficult to analyze all the metrics to draw meaningful conclusions. Note, however, that some metrics may be correlated. For instance, a long latency cache miss may cause pipeline stalls. Correlated data can skew similarity analysis— many correlated metrics will overemphasize a particular property’s importance. So we eliminate correlated data before analysis. Principle Component Analysis (PCA) is a common method for removing such correlated data. We first normalize metric values to a Gaussian distribution. Then we use Kaiser’s Criterion to choose the number of principle components (PCs). Finally we choose nine PCs, which retain 89.3% variance.
3) Workloads Similarity
In order to show the similarity among each workload, we also employ hierarchical clustering, which is one common way to perform such analysis, for it can quantitatively show the similarity among workloads via a dendrogram. Figure I show the dendrogram, which quantitatively measures the similarity of the full BigDataBench workloads (version 3.0). The dendrogram illustrates how each cluster is composed by drawing a U-shaped link between a non-singleton cluster and its children. The length of the top of the U-link is the distance between its children. The shorter the distance, the more similar between the children. We use Euclidean distance. Further, we use the single linkage distance to create the dendrogram.

Figure 1 Similarity of the full BigDataBench 3.0 workloads.
4) Clustering
We use K-Means clustering on the nine principle components obtained from the PCA algorithm to group workloads into similarly behaving application clusters and then we choose a representative workload from each cluster. In order to cluster all the workloads into reasonable classes, we use the Bayesian Information Criterion (BIC) to choose the proper K value. The BIC is a measure of the “goodness of fit” of a clustering for a data set. The larger the BIC scores, the higher the probability that the clustering is a good fit to the data. Here we determine the K value that yields the highest BIC score.
We ultimately cluster the 77 workloads into 17 groups, which are listed in Table I.
Table I Clustering results
|
Cluster |
Workloads |
| 1 | Cloud-OLTP-Read, Impala-JoinQuery, Shark-Difference, Hadoop-Sort, Cloud-OLTP-San, Ipala-TPC-DS-query8, Impala-Crossproduct, Impala-Project, Impala-AggregationQuery, Cloud-OLTP-Write |
| 2 | Hive-TPC-DS-query10, Hive-TPC-DS-query12-1, Hive-Difference, Hadoop-Index, Hive-TPC-DS-query6, Hive-TPC-DS-query7, Hive-TPC-DS-query9, Hive-TPC-DS-query13, Hive-TPC-DS-query12-2 |
| 3 | Hive-Orderby, Hive-SelectQuery, Hive-TPC-DS-query8, Impala-SelectQuery, Hive-Crossproduct, Hive-Project, Hive-JoinQuery, Hive-AggregationQuery |
| 4 | Impala-TPC-DS-query6, Impala-TPC-DS-query12_2, Hive-TPC-DS-query3,Spark-NaiveBayes, Impala-TPC-DS-query7, Impala-TPC-DS-query13, Impala-TPC-DS-query9, Impala-TPC-DS-query10, Impala-TPC-DS-query3 |
| 5 | Shark-Union, Spark-WordCount, Shark-Aggregation-AVG, Shark-Filter, Shark-Aggregation-MAX, Shark-SelectQuery, Shark-Aggregation-MIN, Shark-Aggregation-SUM |
| 6 | Impala-Filter, Impala-Aggregation-AVG, Impala-Union, Impala-Orderby, Impala-Aggregation-MAX, Impala-Aggregation-MIN, Impala-Aggregation-SUM, |
| 7 | Hive-Aggregation-AVG, Hive-Aggregation-MIM, Hive-AggregationSUM, Hadoop-Grep, Hive-Union, Hive-AggregationMAX, Hive-Filter, Hadoop-Pagerank |
| 8 | Shark-TPC-DS-query9, Shark-TPC-DS-query7, Shark-TPC-DS-query10, Shark-TPC-DS-query3 |
| 9 | Shark-AggregationQuery, Shark-TPC-DS-query6, Shark-Project, Shark-TPC-DS-query13 |
| 10 | Shark-JoinQuery, Shark-Orderby, Shark-Crossproduct |
| 11 | Spark-Kmeans |
| 12 | Shark-TPCDS-query8 |
| 13 | Spark-Pagerank |
| 14 | Spark-Grep |
| 15 | Hadoop-WordCount |
| 16 | Hadoop-NaiveBayes |
| 17 | Spark-Sort |
5) Representative Workloads Selection
There are two methods to choose the representative workload from each cluster.The first is to choose the workload that is as close as possible to the center of the cluster it belongs to. The other is to select an extreme workload situated at the “boundary” of each cluster.
Combined with hierarchical clustering result, we select the workload situated at the “boundary” of each cluster as the representative workload. The rationale behind the approach would be that the behavior of the workloads in the middle of a cluster can be extracted from the behavior of the boundary, for example through interpolation. So the representative workloads are listed in Table II. And the number of workloads that each selected workload represents is given in the third column.
Table II Treat the marginal ones as representative workloads
| Workload name | Number of workloads in its cluster | |
| 1 | Cloud-OLTP-Read | 10 |
| 2 | Hive-Difference | 9 |
| 3 | Impala-SelectQuery | 9 |
| 4 | Hive-TPC-DS-query3 | 9 |
| 5 | Spark-WordCount | 8 |
| 6 | Impala-Orderby | 7 |
| 7 | Hadoop-Grep | 7 |
| 8 | Shark-TPC-DS-query10 | 4 |
| 9 | Shark-Project | 4 |
| 10 | Shark-Orderby | 3 |
| 11 | Spark-Kmeans | 1 |
| 12 | Shark-TPC-DS-query8 | 1 |
| 13 | Spark-Pagerank | 1 |
| 14 | Spark-Grep | 1 |
| 15 | Hadoop-WordCount | 1 |
| 16 | Hadoop-NaiveBayes | 1 |
| 17 | Spark-Sort | 1 |
Here we provide the package that only includes the workloads in Table II, so that the users can download the subset and deploy them on their own platform. The package and user manual can be found through the following links:
Workloads in Table II download: Marginal_ones_as_representatives.tar [User Manual]:PDF
In the case that researchers need the workloads which are chosen by the first method, i.e. choosing the workload that is as close as possible to the center of the cluster, we also list them in Table III.
Table III Treat the central ones as representative workloads
| Workload name | Number of workloads in its cluster | |
| 1 | Cloud-OLTP-Write | 10 |
| 2 | Hive-TPC-DS-query13 | 9 |
| 3 | Hive-AggregationQuery | 9 |
| 4 | Impala-TPC-DS-query6 | 9 |
| 5 | Shark-Union | 8 |
| 6 | Impala-Aggregation-MAX | 7 |
| 7 | Hive-Aggregation-AVG | 7 |
| 8 | Shark-TPC-DS-query7 | 4 |
| 9 | Shark-TPC-DS-query6 | 4 |
| 10 | Shark-Crossproduct | 3 |
| 11 | Spark-Kmeans | 1 |
| 12 | Shark-TPCDS-query8 | 1 |
| 13 | Spark-Pagerank | 1 |
| 14 | Spark-Grep | 1 |
| 15 | Hadoop-WordCount | 1 |
| 16 | Hadoop-NaiveBayes | 1 |
| 17 | Spark-Sort | 1 |
The following links also provide the applications listed in Table III for researchers to download.
Workloads in Table III download: Central_ones_as_representatives.tar [User Manual]:PDF
2.3 Simulator version
The workloads listed in Table II can representative the 77 workloads in BigDataBench. So to facilitate micro-architectural simulation, we deploy the 17 representative applications listed on Simics and MARSSx86, we also provide gem5 version in Hadoop standalone mode. We then provide the simulator images of these three full system simulators for researchers to download.
The workloads in BigDataBench are all distributed workloads using big data software stacks such as Hadoop, Spark and etc. Those workloads are running on a cluster, which consists of a master and several slaves nodes. The master node is responsible for distributing tasks, while the slave nodes are executing the tasks. We simulate a two-node cluster (one master and one slave), and we provide both images. Users should boot up both the images and submit the job on the master node. For the slave node is responsible for processing the whole job, if users want to get some performance data, slave node should be focused on.
User manuals: [BigDataBench Simulator Version] [BigDataBench GEM5 Version]
Simics Images download: Master-image, Slave-image
MARSSx86 Images download: Master-image-hadoop, Slave-image-hadoop. Master-image-impala, Slave-image-impala
MARSSx86 Network Config Scripts package download: MARSS-network-script
Gem5 Images download: BigDataBench-gem5.img, linux-bigswap2.img, vmlinux-22-22-64
2.4 Contacts
- gaowanling@ict.ac.cn
- linxinlong@mail.bafst.com
- zhanjianfeng@ict.ac.cn
- wl@ncic.ac.cn
2.5 For Citations
If you need a citation for the BigDataBench architecture subset or the simulator version, please cite the following papers related with your work:
BigDataBench: a Big Data Benchmark Suite from Internet Services. [PDF]
Lei Wang, Jianfeng Zhan, ChunjieLuo, Yuqing Zhu, Qiang Yang, Yongqiang He, WanlingGao, Zhen Jia, Yingjie Shi, Shujie Zhang, Cheng Zhen, Gang Lu, Kent Zhan, Xiaona Li, and BizhuQiu. The 20th IEEE International Symposium On High Performance Computer Architecture (HPCA-2014), February 15-19, 2014, Orlando, Florida, USA.
Characterizing and Subsetting Big Data Workloads. [PDF]
Zhen Jia, Jianfeng Zhan, Wang Lei, Rui Han, Sally A. McKee, Qiang Yang, Chunjie Luo, and Jingwei Li. In 2014 IEEE International Symposium on Workload Characterization (IISWC 2014).